ANSI/ISA-101
Research has shown that the human being is able to interpret analog values presented more quickly than digital values. We are very visually oriented.
Example: People do not care what time it is. People care about how much time they have between now and some other event.
Your next meeting is at two o´clock. You make a split second glance at your watch, can you make the meeting?
The analog clock is much more suited to the human ability to quickly interpret analog values. A conventional clock can show, in literally a small fraction of a second glance: “I have about 10 minutes until the meeting.” Interpreting a digital display of 13:48:58 takes longer and requires more mental effort.

There is a big difference between data and information. Data must be placed in context in order to be able to adequately interpret the status of the process.
Based on this data, a number of elements are developed that can present the information at a glance.
Below an example of a new developed High Performance element.
ANSI/ISA-101
To determine the health of a pet, blood is taken and tested in a number of important values. Find the result of the blood test in the table on the right.
A veterinarian, a person who is able to correctly interpret the values, can only evaluate these results.
| BLOODTEST RESULTS | |
| TEST | RESULT |
| HCT | 31.7 % |
| HGB | 10.2 g/dl |
| MCHC | 32.2 g/dl |
| WBC | 9.2 x 10⁹/L |
| GRANS | 6.5 x 10⁹/L |
| L/M | 2.7 x 10⁹/L |
| PLT | 310 x 10⁹/L |
Using the newly developed elements, the information of the results can be seen at a glance. The analog values can even be omitted, the indication in itself already gives enough information. As long as the indicator remains within the normal range, intervention is not necessary.
| BLOODTEST RESULTS | ||||
| TEST | LOW | NORMAL | HIGH | |
| HCT |  |
|||
| HGB |  |
|||
| MCHC |  |
|||
| WBC |  |
|||
| GRANS |  |
|||
| L/M |  |
|||
| PLT |  |
|||
ANSI/ISA-101
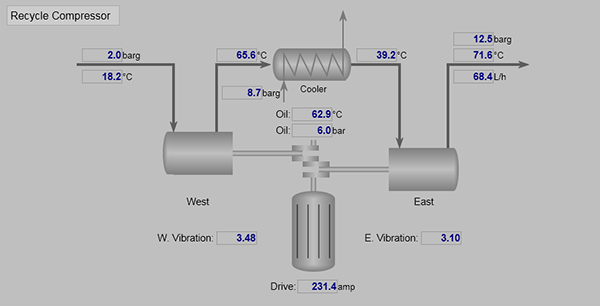
As an example, consider this depiction of a compressor. Much money has been spent on the purchase of instrumentation. Yet, unless you are specifically trained and experienced with this compressor, you cannot tell if it is running at the peak efficiency or is about to fail.
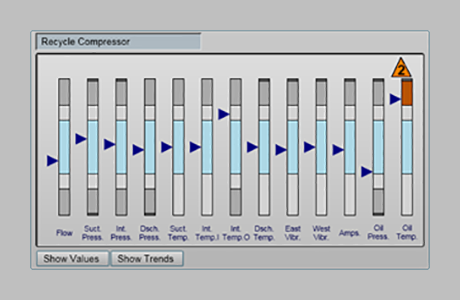
The presentation of a similar compressor. Presented in a bank of analog indicators. With a single glance at this bank of properly designed analog indicators, the operator can tell if any values are outside of the normal range, by how much, and the proximity of the reading to both alarm ranges and the values at which interlock actions occur.
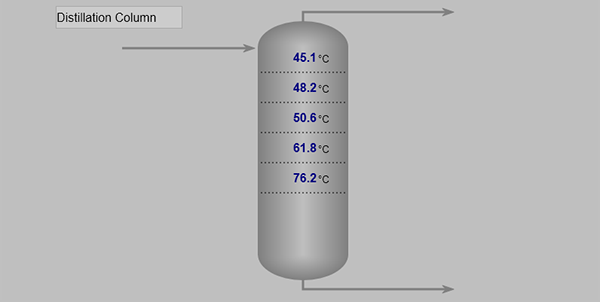
This is an example of a display of a distillation column, commonly used as operator interface. The display shows a great amount of data that needs to be interpreted. Important in the assessment of the status, are the temperature measurements in the column.
The assessment requires a great mental effort.
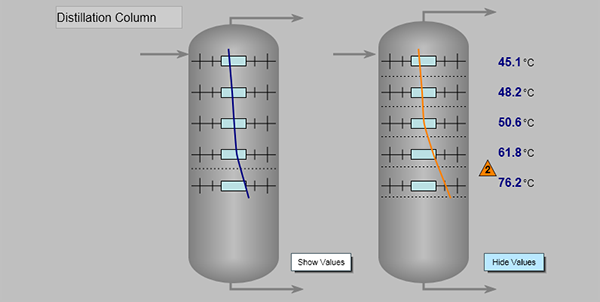
By showing the temperature measurements as an analog profile the situation can be reviewed at a glance.
Measured values may be presented next to the profile indication as an option. The changing of the line color when an abnormal situation occurs is also optional.
ANSI/ISA-101